 If you are even remotely related to either of the following professions: Quality, Six-Sigma, Reliability, or Quantitative Analysis used in agricultural/clinical/medical research; I' am sure you have used or heard of Minitab at one point. Minitab is the most widely used software package for data-analysis and statistics. I use it for all sort of data crunching I need to do as part of Six-Sigma projects and I really like it. The package in itself has evolved a lot and become lot more user friendly rather than statistician friendly as it used to be long ago.
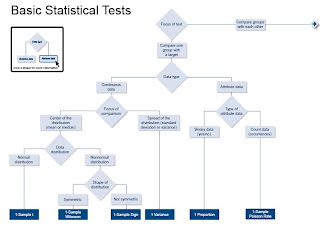
One thing I like in particular is the Resources section on their website, which has lots of tutorials, tips, and tricks on using the software. Recently they have released a"Method Chooser". If you are wondering what it is exactly, then let me quote it from their website:
"Method Chooser directs you to the Minitab analysis that’s most appropriate for your data and your objectives. This tool provides an interactive decision tree for each key area and includes concise explanations and concrete examples for support. Use it to quickly grasp the basic requirements and perform the right analysis, every time."
In essence, it is a detailed statistical data-analysis roadmap to lead you to the right analysis for your data-type and your intended purpose of analysis. I have used such roadmaps in past and they tend to be very useful. This time, Minitab has really done a terrific job by putting the most comprehensive roadmap, I have ever seen. You can download the whole package from this link. It consists of five sections as following:
- Basic Statistical Tests
- Regression and ANOVA
- Measurement Systems Analysis
- Control Charts
- Capability Analysis

Here is a screen-shot of an example from the road map. The examples described in the main window are corresponding to the analysis shown in the left menu bar. Isn't it great that you don't have to flip through pages or scroll around to match the text with the road map?
"On a side note, I find the name "Method Chooser" to be very funny. I am sure some statistician coined this term, and not a marketing or sales guy."


