ProcessImprovementBlog

Achieve Excellence in Business Processes

Showing posts with label Six Sigma. Show all posts

Guest Post: Six Sigma - A Splendid Waste of Time

Kanishk's Note: One of the foundation of any continuous improvement process is: Feedback. 
So, here is a very honest and direct feedback on Six Sigma from our guest author, James Lawther
I will address his points in a separate post.
 
I work in the service industry.  For my sins I am responsible for process improvement.

Six Sigma is widely regarded as the process improvement methodology of choice.  The logic is that as an industry we are data rich, so a process improvement methodology that is data led has to be a good thing.  Consequently there has been a huge investment in Six Sigma training over the past few years.  I have master black belts and black belts and green belts and yellow belts coming out of my ears.  Thousands, if not millions of pounds have been spent on Minitab licences, training manuals, and consultants.

And I guess that 99% of it has been a splendid waste of time, let me be stronger, Six Sigma has precisely no practical application in my industry at all (might as well be hung for a sheep as a lamb).  If that sounds a little strong let me explain why.

Six Sigma is a great tool for process improvement.  If you have a multimillion pound production line that makes light bulbs at 1,000 a minute and 1 of them fuses the instant it is plugged into the power there is really only one way to diagnose the problem.  Like it or not, it is going to involve a fishbone diagram and a bit of regression analysis.  When you have a problem like that you need all the surgical precision you can get to find the root cause and fix it.  You need a statistical scalpel.

The service industry doesn't work that way though.  We don't invest millions in dedicated production lines and supply chains.  We invest millions in databases and people.

Now here is the thing: databases and people are flexible, you can add bits, change bits, do extra stuff, provide bespoke outcomes for bespoke customers.  And as a consequence we do.  It sounds great but we end up with the curse of proliferation.

We end up with a production line that produces 1,000 shapes of light bulb in a thousand different colors at one every 3 minutes.  We don’t care how many of them work; we are too busy looking for the one our customer wants.

We don’t need statistical scalpels; we need common sense and a mop to clean up the mess.

James Lawther gets upset by operations that don’t work and apoplectic about poor customer service.  Visit his web site “The Squawk Point” to find out more about service improvement.

About Squawk Point: The Squawk Point is about the way large organizations work. The way in which organizational design, business processes, operational delivery and staff ambition and motivation interact.  It is about the myriad of ways in which clever people make life difficult for themselves, their colleagues and their customers.


Risk Analysis in Process Design

Any good process improvement project, will have a slide with the before & after process map. The "before" process map depicts the process as-is, ideally at the project/initiative kick-off. The "after" process map shows the future state of the new, improved process. The hypothesis here is that the new, improved process, if implemented, will result in waste-elimination, reduced cycle-time, higher efficiency, increased output etc. depending on the scope of project.

Now, when the project leader, who is usually the Black Belt or Master Black Belt, presents this proposed process to either the leadership team, champion, or key stakeholders to get their buy-in, one question is usually asked.

"What are the risks involved with this new process? What can we potentially miss if we implement this process? What will fall apart if we stop following the current process?"

In my opinion, a very simple tool can be used to address these valid concerns. I call it Risk-Opportunity chart. I am not sure if it is a part of the standard Lean/Six-Sigma tool-set, but found it to be very useful. In the form of a classic four-blocker, this tool provides an excellent visual of not only the risks involved, but the opportunities associated along with. Remember that with every risk, comes an opportunity.

The Risk-Opportunity matrix will look like this. This is definitely a team-based tool. The Black Belt or project leader will facilitate this tool with the project team members, consisting of the process-owner and key experts of current process.

Steps:

1. Assemble the team in a room. Post the "before" and "after" process maps posted on a side-wall (on flip charts). Draw the four-blocker on a flip-chart.

2. Start going over the "after" process map step by step while asking the question: what are the potential risks involved here? You may refer to the "before" process-map whenever needed. (Having a high-level SIPOC of current process will immensely help)

3. Quantify every risk as Low or High per team consensus. For every risk, ask what is the associated opportunity. Quantify the opportunity as Low or High per team consensus.

4. Write the risk/opportunity pair in appropriate block of the four-blocker.

After finishing the data-collection, chart a strategy to address these risks involved in the priority shown as 1-2-3-4 . This tool will greatly enhance your understanding of the new process and its potential impact on other processes as well. Also, the visual created will come as a handy tool to communicate the analysis to others.

Let me know if you have questions or feedback regarding this.

Process-Mapping on YouTube

Sometimes, the wealth of real knowledge freely available on WWW just amazes me. It just depends on us, how we choose to spend our time and utilize the power of Web 2.0 in enhancing our knowledge base and honing our skill-set. For instance check this video on "Process-Mapping in Lean Six Sigma". Gone are those days, when companies had to higher highly paid consultants to train their work-force in process improvement tools, when the good quality stuff is available online...free. However, it does a lot of motivation and focus to do such things online. Maybe that's why the classroom training still exists. Anyway, enjoy the video:

Think Process!!! ....But how?

In those rare cases, where an explanation of Process & Process Management (per my previous post) is able to generate the other person's interest, the conversation usually goes this way:

Him: "Interesting! So, you are a process improvement professional."
Me" "Yeah! sounds like fun ..isn't it?"
Him: "Maybe for yourself..... So, tell me one thing.."
Me: "Sure"
Him: "What is your general approach when you are doing problem-solving and/or process-improvement?"
Me: " Well...The mantra of success is always: Think Process!. One has to develop his process-based thinking and the ability to visualize a process, no matter how complicated the problem is."
Him:"Hmmm.....but how do you do that?"
Me: "Well, maybe it just comes naturally...or ...aaaannn...I don't know. Seriously!"

This conversation sent me through the thinking path: How do you develop the process based thinking? And the answer came in the form of a SIPOC, an acronym for Supplier, Inputs, Process, Outputs, and Customers. In Six-Sigma DMAIC roadmap, SIPOC analysis is used the Define phase to map the high-level process and the relationships among suppliers, process, & customer via respective inputs & outputs. A quick search over Google brought this excellent link on SIPOC Analysis and the steps needed to perform one. A typical SIPOC diagram for a project looks like this:

Now coming back to the point, how does SIPOC help to generate process based thinking? Whenever you are trying to understand a problem symptoms, try to identify what is the main process involved here and what are it's inputs and outputs. Next, think about who is supplying the inputs and how can they impact the quality (in either positive or negative way) of the process and it's outputs. Next, identify the outputs and whom and what they impact, i.e. the customers or other processes. Let me give a simple example:

Say, one fine morning, your coffee doesn't taste good, or rather let's say it tastes real bad. Now the Process here is coffee-making. The equipment used is the coffee-maker and the process parameters are temperature, length of time for brewing, etc. The Inputs of the process are coffee beans, and water (and sugar, creamer, etc.). Suppliers are coffee-bean company, & water supply (or bottled water company). Output is off-course the coffee (which is of bad quality) and the Customer is the coffee-drinker (in this case, is yourself).

I agree that this is a very simple example compared to the processes we deal with in a business or organization, but the idea is that one's thought process has to be aligned in a SIPOC way. This will help you a lot in ....guess what...."thinking process".

Data.gov

Recently, I found this cool website, which is essentially a huge data-dump. It has all kinds of data-sets to play around and hone your statistical tool skills. From my six-Sigma training and the subsequent trainings I have given to Green-Belts, I found that the data-sets used in the examples, and practice sessions are very boring and manufacturing oriented. This website, www.data.gov, has some really cool data which can be more meaningful in teaching the analytical & statistical tools to the Green/Black Belts. The website introduction is:


"The purpose of Data.gov is to increase public access to high value, machine readable datasets generated by the Executive Branch of the Federal Government. Although the initial launch of Data.gov provides a limited portion of the rich variety of Federal datasets presently available, we invite you to actively participate in shaping the future of Data.gov by suggesting additional datasets and site enhancements to provide seamless access and use of your Federal data."

"Data.gov includes searchable
data catalogs providing access to data in three ways: through the "raw" data catalog, the tool catalog and the geodata catalog. "

I downloaded the "Airline On-Time Performance and Causes of Flight Delays" data-set and started playing around with it. It has all kinds of data, which can be used to make interesting and more engaging case-studies, than the standard age-old examples from manufacturing, cycle-time, etc. still being used in the trainings, where a good majority of people are from transactional backgrounds. Well, I'm working on making something from these enormous data-sets and will put them here soon.

Enjoy playing with the data!!!

Process Management

For last few days, I have been thinking that what should be the first post on this redesigned blog. And after some thought, I decided to post on the concept of "Process Management". Time and again, people ask me what do I do? Merely saying that I am a "Six Sigma Black Belt" actually doesn't help much. It is usually followed by a "What do you actually do?" look. Then I try to explain my job further by talking about quality, continuous improvement, and process management. So, what exactly is process management? What is a process? What is process improvement?

Based on my experiential learning, I have made a visual to explain these terms and their inter-relationships. And now I will try to explain them.

Process: A series of steps, or tasks which add value to their inputs and result in an output. An input can be in the form of information or a physical material. Similarly, the output of a process can be in the form of a material, product, or information.

Process Improvement: It includes a series of tasks with the sole objective of improving the process. The improvement can be in terms of improving the quality of the output, increasing the efficiency of the process, or reducing the operating cost of the process itself. The data generated from process-monitoring and the feedback on the output need to be analyzed properly to identify the improvements needed in the process, or in the process-monitoring to get a better picture of the process. The last but not the least is the execution of those improvements leading to process management.

Process Management: Process Management means the ability to manage processes efficiently and improving them continuously. It encompasses an expertise in utilizing the tools-set of Six-Sigma, Lean, Project Management, Systems Thinking etc., the art of devising right strategy, and the ability to drive change in the system & among the people. It is the efficient process management which results in a sustainable change/improvement in the process.

Now, processes exists at each and every layer in the hierarchy of an organization. Those at the high level are termed as business processed, while the ones in the subsequent layers are called functional processes. And never forget that no matter what your process is, it needs to be improved!

Minitab Method Chooser

If you are even remotely related to either of the following professions: Quality, Six-Sigma, Reliability, or Quantitative Analysis used in agricultural/clinical/medical research; I' am sure you have used or heard of Minitab at one point. Minitab is the most widely used software package for data-analysis and statistics. I use it for all sort of data crunching I need to do as part of Six-Sigma projects and I really like it. The package in itself has evolved a lot and become lot more user friendly rather than statistician friendly as it used to be long ago.

One thing I like in particular is the Resources section on their website, which has lots of tutorials, tips, and tricks on using the software. Recently they have released a"Method Chooser". If you are wondering what it is exactly, then let me quote it from their website:

"Method Chooser directs you to the Minitab analysis that’s most appropriate for your data and your objectives. This tool provides an interactive decision tree for each key area and includes concise explanations and concrete examples for support. Use it to quickly grasp the basic requirements and perform the right analysis, every time."

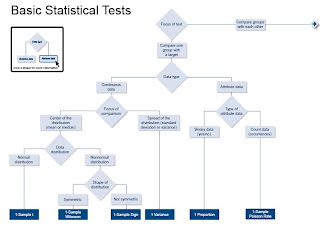
In essence, it is a detailed statistical data-analysis roadmap to lead you to the right analysis for your data-type and your intended purpose of analysis. I have used such roadmaps in past and they tend to be very useful. This time, Minitab has really done a terrific job by putting the most comprehensive roadmap, I have ever seen. You can download the whole package from this link. It consists of five sections as following:
  1. Basic Statistical Tests
  2. Regression and ANOVA
  3. Measurement Systems Analysis
  4. Control Charts
  5. Capability Analysis

Here is a screen-shot of an example from the road map. The examples described in the main window are corresponding to the analysis shown in the left menu bar. Isn't it great that you don't have to flip through pages or scroll around to match the text with the road map?


"On a side note, I f
ind the name "Method Chooser" to be very funny. I am sure some statistician coined this term, and not a marketing or sales guy."

Surveys & Data-Collection


Conducting surveys is a widely used method of data-collection, especially when one is trying to use the opinion of people regarding a product or service. The biggest advantage of this technique is the direct hold of "Voice of Customer". It also proves to be a useful tool in those situations where the data actually doesn't exist is very difficult to get hold of, like salary surveys, college rankings etc. In such cases, certain organizations conduct a survey of professionals, or colleges to gather the data, analyze it, quantify the results, and make interpretations.

This is where the problem occurs, the interpretation, and not the data. Recently I read the IndustryWeek's 2009 Salary Survey. Conducted and published annually, this survey targets the professionals in the manufacturing industry. This survey is quiet detailed and presents the average salary results by industry, education level, geographic region, race, company-size, and what not. You can see the detailed Charts & Tables here. But writing about this survey is not my point, however the interpretation is.

The summary of the survey, as expected due to the current economic scenario, is:

"As the U.S. economy gets leaner and meaner, IndustryWeek's 2009 Salary Survey reveals that the average salary for manufacturing management has dropped to $95,248."

But what prompted me to think about the survey methodology is this:

'When asked, "How satisfied are you with your current job?" 76% say they are "very satisfied" or "satisfied," which is actually a slight bump up from the 74% response rate in both 2007 and 2008. And when asked about their choice of manufacturing as a career path, 80% say they are "very satisfied" or "satisfied," a slight dip from the 83% in 2008 but slightly better than the 79% in 2007. Clearly, both resiliency and pride are still alive and well in the U.S. manufacturing industry."

Now this is a contradiction, isn't it? How come the people are satisfied even when the salaries are going down, and rather worse, even jobs are going away by thousands? The answer lies in the paragraph immediately following the above, which, in my opinion, is the biggest pitfall of "Survey & Interpretation" technique.

"In this year's survey, nearly 1,700 readers participated in our anonymous survey, ........"

Now guess, who are the regular readers of IndustryWeek??? The professionals in manufacturing world...obviously. So the survey itself is limited to only those who are somehow related to manufacturing profession. no wonder, so many of them are "satisfied" or "very satisfied". Probably the people who are not satisfied have already changed their profession or didn't bother to respond to the survey.

Isn't it similar to Apple sending a survey to all iPhone users asking how much they like their iPhone? Probably the people who don't like it have already switched to some other phone.

Thus, one needs to be extremely careful in selecting the sample from which (s)he wants to draw his survey results. Your objective is to get the best out of this tool and use the results to improve your products or services. And be aware of your sampling constraints while drafting the survey questions.

Problem Solving Flowchart


I always find it interesting when people use their otherwise useful skills in a humorous manner. Take a look at this "Problem Solving Flow Chart". Just think about how many times either you or someone in your acquaintance has followed this chart either completely or even partially. Just don't be surprised with the results. Keep laughing...it's good for health!!!

The Six Sigma Way by Peter Pande


Read it thoroughly! yes, that is the best way I can describe this book.

"The Six Sigma Way" by Peter Pande is THE best book on Six Sigma. Peter Pande has done a great job in explaining the concept of Six Sigma through this text. If you are Black Belt, or Master Black Belt, or just someone thinking to go that path, this book will prove to be a very useful source of information. Most companies provide their own training material for Six Sigma. However, such material is only good to know the various tools, their examples and how to use them. In order to be successful in this profession, you need to go beyond that material to understand the philosophy of Six Sigma. This book talks about all those "behind the scenes" things, which one needs to understand in order to properly implement Six Sigma and manage multiple projects. I found it useful on top of my training material and classroom training. Moreover, the authors have an extensive experience with Six Sigma, which brings a practical aspect to their writing and language, a very necessary attribute to enhance reader's understanding.

This book is divided into three parts:

I. Executive Overview - Understanding of Six Sigma and why it works. It is also good to build your pitch to convince your leadership team.

II.How to Prepare for Implementation - what are key roles in Six Sigma, how to select right people for those key roles, and how to get buy-in of key stakeholders.

III. Roadmap: Steps on how to actually implement Six Sigma. tells you how to select the processes and projects to make a solid impact on your business.

In my personal opinion, as a Six Sigma professional, you will always learn something new, every time you go through the pages of this book.

Attributes of a Black Belt

Six Sigma Black Belt is a very challenging and demanding job, no matter, how enticing the title might sound. There are multiple stories on how the term "Black Belt" was coined and if it has any link to karate. As various sources indicate, this term term was coined in Motorola in the early days of Six Sigma and is, indeed, drawn from martial arts. "Black Belt" term signifies a systematic, intensive training to achieve a certain depth in the skills needed to perform the required tasks successfully. It requires a mental discipline and experience to attain that level.

Apart from the technical and statistical skills, there are some other skills, which a Black Belt has to possesses and demonstrate in order to successfully execute his/her projects. Below are a few of them, either from my own experience, or from leftovers of some article/book.

  • A Black belt has to be patient, yet persuasive. Let the data drive the conclusion and not just the past experience, intuition or gut feeling of either yourself or your champion, or your team members. Follow the road-maps taught in your training.
  • Demonstrate leadership skills, to keep your team members focused and achieve the desired results. Never use "Just Do It" approach.
  • Be imaginative and creative in driving the improvement process. Think outside the box and use the power of your data and Six Sigma tools.
  • Black Belt should be able to translate the vision of leadership, their intention, to the real world, i.e. his/her team. The challenge here, is to communicate the visions at lower levels of hierarchy without losing the real essence.
  • Black Belts are change agents working with their teams to execute the vision of their leadership. They should be able to overcome resistance to change from others and get them to practice new behavior.
  • Be ready to take responsibilities and risks. If something goes wrong, only you are accountable for it. If everything goes well, whole team gets appreciation.
  • Question every process, and every step in the process. Rethink the existing business processes and improvise them.
Remember, that this is not an all inclusive list or the success-mantra. There is always more to it....

What is Six Sigma?

What is Six Sigma? This question has been posed to me several times from different people. Everytime, I try to answer the question, depending on the person's professional background & awareness with business processes. There are myriad books and articles on this topic, written by stalwarts and experts of Six Sigma. Before, I define it myself, here are a few definitions from other sources:

"Six Sigma is a business management strategy, originally developed by Motorola, that today enjoys wide-spread application in many sectors of industry.

Six Sigma seeks to identify and remove the causes of defects and errors in manufacturing and business processes. It uses a set of quality management methods, including statistical methods, and creates a special infrastructure of people within the organization ("Black Belts" etc.) who are experts in these methods. Each Six Sigma project carried out within an organization follows a defined sequence of steps and has quantified financial targets (cost reduction or profit increase)."

"Six Sigma at many organizations simply means a measure of quality that strives for near perfection. Six Sigma is a disciplined, data-driven approach and methodology for eliminating defects (driving towards six standard deviations between the mean and the nearest specification limit) in any process -- from manufacturing to transactional and from product to service."

As a practising Six Sigma Black Belt, here is how I define this concept to someone, who is remotely related to engineering, manufacturing, or statistics:

Six Sigma is a structured customer-focussed, data-driven, problem-solving approach to improve business processes and making a direct postive impact on business profits. 

The terms used are defined as follows:

Structured: Believe and follow the steps as described in the roadmaps. 
Customer-focussed: What will my customer like in my product or service?
Data-driven: Do not jump on solutions. Let the data drive the conclusions.
Problem-solving: A well-defined problem affectine our business, either directly or indirectly.
Business processes: Functional processes inside a businesses. Can be drilled down deeper.


A Funny Flowchart

Flowcharts and process maps are one of the main tools of a continuous improvement profesisonal. We use them for many purposes including mapping current-state map, future state map, problem-solving flow chart and what not. Not only this, we have different types of maps too, like, functional flowchart, sequential flow chart, time-series flow chart and what not. 

And then, some people do find innovative and funny uses of flow chart too. Here is an example from the Vice-presidential debate between Sarah Palin and Joe Biden, I got in a forwarded email.

Disclaimer: The author of this post has no intention to hurt the reader's feelings on basis of his/her political inclination, whatsoever it maybe. This post is for fun purpose.

Statistics in Olympics

Summer Olympics 2008 are over now and by now I am trying to catch up with my sleep. With such a great variety of sports and superb performances from players all over the world, it was really difficult to resist watching them, even with their late night broadcasts. The scoring pattern of various sports and the performances of the athletes have always made me curious, in terms of statistics. We know that the best performaces of athletes which usally creates world records are the outliers of their performance distribution, which tends to be normal. However, I never thought anything beyod that, till I read this post on Freakonomics Blog. It refers to a graphic from The New York Times and discusses how extreme outlier was the Usian Bolt's performance in 200 m sprint.


There is this another post on iSixSigma blog basting the tie-breaking rule in Gymnastics. I was not able to completely understand this rule too, while watching the live performance and felt that it was an appropriate way of measuring a gymnast's performance. By removing the lowest score in case of a tie, Nastia actually lost a higher score than He Kexin and lost the gold medal........

"An arbitrary and statistically flawed tie-breaking rule cost Nastia Liukin of the United States the gold medal in the women’s uneven bars competition at the Olympics earlier this month, according to Dr. Prasad Raje, CEO of Instantis.

After looking at the tied scores of gymnasts Liukin and He Kexin of China, Raje figures that Liukin actually had a “statistically superior score because there was less variance in the judge’s opinions on who performed better.”"


Statz Rappers

Check this very cool rap video with statistics in the lyrics. It might be a good one to show during the break times of your Six Sigma training class. These people are really very creative with their statistics.....that's for sure....

The description per Google Video:

"The number 1 hit jam of Summer '06 is here: Da Statz Krew's "Statz 4 Life"! This video debuted in a Research Methods in Psychology course taught by then University of Oregon (ABD) graduate student Chuck Tate on May 18, 2006. This video is Chuck's attempt to get students to enjoy statistics as much as they enjoy hip-hop. ......Special thanks to Nelly's song "Grillz," of which this song and video are a parody."


Combining Mega-Tools for Continuous Improvement

There are various approaches utilized in continuous improvement and each of them is unique in its own aspect. Professionals in the area on continuous improvement and quality management face this dilemma of which approach is suited best for their needs and problems. Some adopt Six sigma, some go for Lean implementation, some choose QFD etc etc.

Recently, I read this very useful text in one of my favorite book for the quality tools, The Quality Toolbox by Nancy R. Tague, published by ASQ Quality Press.

Here is the excerpt, which I found very useful......
"
  • Lean manufacturing focuses on speed and efficiency: eliminating waste.
  • Six Sigma focuses on quality: eliminating defects through reduced variation.
  • MBNQA focuses on leadership: implementing management systems for performance excellence.
  • Benchmarking focuses on best practices: seeking great ideas for breakthrough improvements.
  • ISO 9000 focuses on consistency: eliminating unpleasant surprises through standardization and discipline.
  • Quality function deployment (QFD) focuses on customers: creating products and services they want.
"
This as an excellent way of combining these different approaches in one complete continuous improvement framework where they are compatible with each other. In fact, since every approach focuses on a different aspect, they complement each other in the whole business improvement process. For example, QFD will tell us the customer requirements translated into our own processes and product attributes. This will provide inputs to lean and Six Sigma programs to improve processes, reduce process times, eliminate defects and build quality. ISO will ensure standardized processes to sustain these improvements and Benchmarking will be useful for senior management to identify & implement best practices within or outside the company and hence keep the cycle of improvement going.


blink & Six Sigma

Looking at the image above, your adaptive unconscious might come to a split-second decision that I am comparing the message given in this book with the philosophy of Six Sigma. (Click here to see my review on blink). This time you might be right. Being a Six Sigma Black Belt, I believe in data-based decision-making and not on that divine thought or "gut-feeling". That does not mean that Six Sigma teaches one to get drowned in analysis before making a small decision. Six Sigma teaches one to improve processes by reducing variation. That variation might result in increased defects, high cycle time or something else, which is adversely affecting the bottom line of the business.

Blink is an interesting read and very grasping indeed. But, the first impression, it gives is that we can make decisions without thinking. Is that right? Can we really harness the huge potential of our mind and make split-second decisions, which are accurate? I think this topic is very debatable. When I read this book, the comparison with Six Sigma instantly popped up in my mind. But now, it feels that these two philosophies are not comparable. However, we probably can utilize the power of hindsight and unconscious, while taking action items on basis of the data analysis results. Say, when we establish y=f(x) of the process, we may use this power to take decisions on how to change x, in order to improve y. Thus, blink & Six Sigma can complemet each other.